
JSC "STCD"
Diagnostics CenterURL: https://diaprom.ru/
E-mail:
Address: office 329, Gazgoldernaya st. 14, Moscow 109518
Telephone/Fax: (495) 690-9195
E-mail:
Address: office 329, Gazgoldernaya st. 14, Moscow 109518
Telephone/Fax: (495) 690-9195
Software Processing Systems for Multi-Channel Measurement Data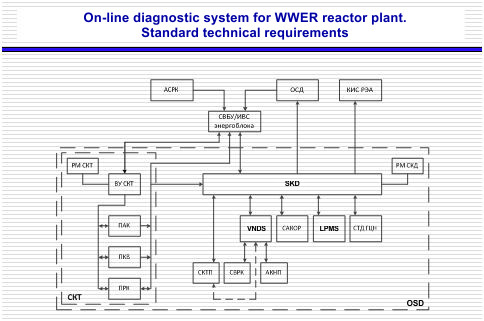 Figure 1. Block diagram of on-line diagnostic system Figure 1. Block diagram of on-line diagnostic systemAn on-line diagnostic system (Figure 1), with the data output to industrial diagnostic system, is a minimal sufficient number of fixed diagnostic systems integrated by LAN with data flow centralized by integrated diagnostic system (SKD). This diagram is a kind of reference to comply with if a sufficient capability to monitor WWER reactor plant is required. Each local diagnostic system processes multi-channel measurement data on real time basis and generates archives of diagnostic data. The archives of diagnostic data are the random processes realizations and/or "compressed" historical record in the form of functionals of the measured processes. Unlike portable tools, fixed diagnostic systems both handle large volumes of data and process them according to complex diagnostic algorithms. Accumulated archives as heterogeneous arrays of diagnostic data from the local diagnostic systems are also diversified in terms of their diagnostic value. However, there are common approaches to their processing implemented as universal software products. These software systems were developed by JSC “STCD” and used to process the archives of local diagnostic systems on a continuous basis. For instance, the same mathematical tool is implemented to develop such diagnostic attributes as:
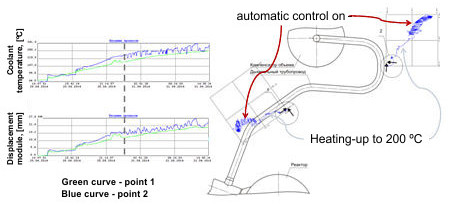 Figure 2. Pipeline Displacement Monitoring System. Kalinin NPP Unit 1. Figure 2. Pipeline Displacement Monitoring System. Kalinin NPP Unit 1.Displacement of Pressurizer Surge Line 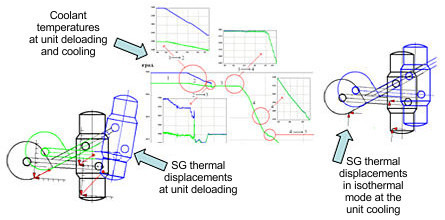 Figure 3 Figure 3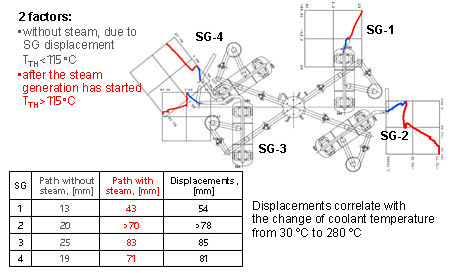 Figure 4 Figure 4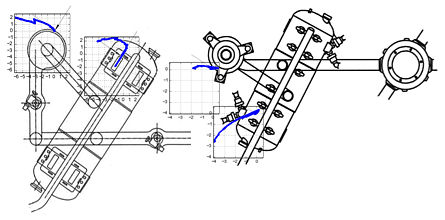 Figure 5. Displacement of SG of «small» and «large» Figure 5. Displacement of SG of «small» and «large»series at uprating
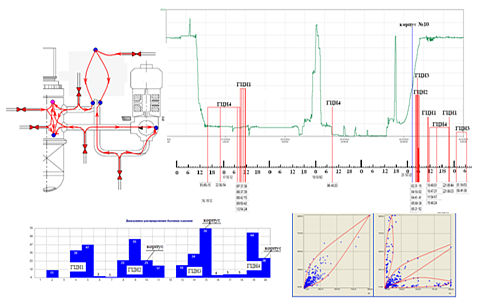 Figure 6 Figure 6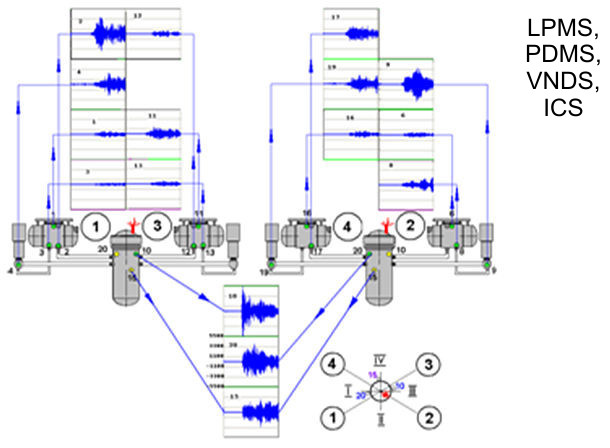 Figure 7 Figure 7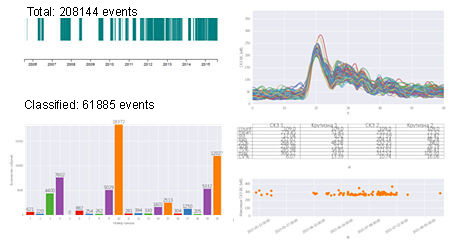 Figure 8. LPMS. Kalinin NPP Unit 3. Classification of events Figure 8. LPMS. Kalinin NPP Unit 3. Classification of events
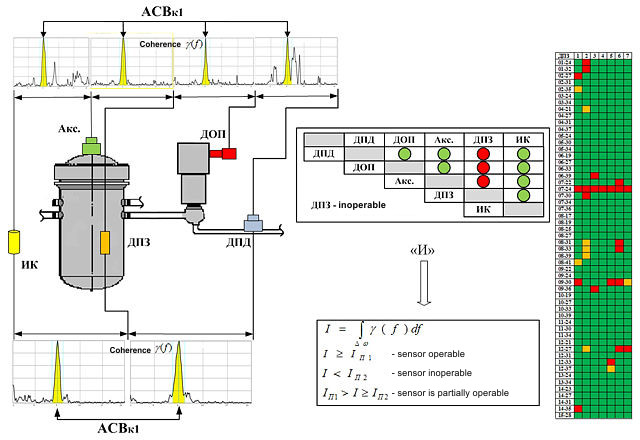 Figure 9 Figure 9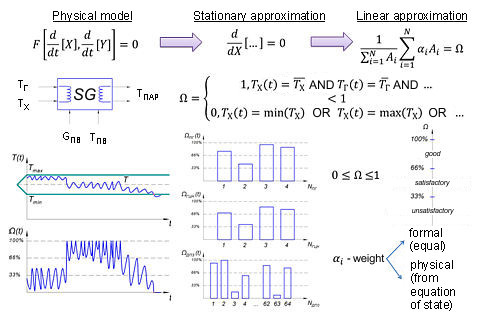 Figure 10. Operability Indicators Figure 10. Operability Indicators
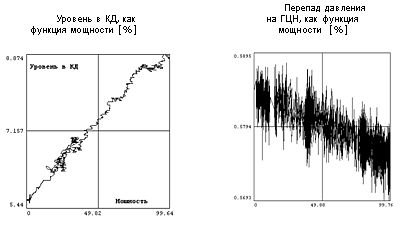 Figure 11 Figure 11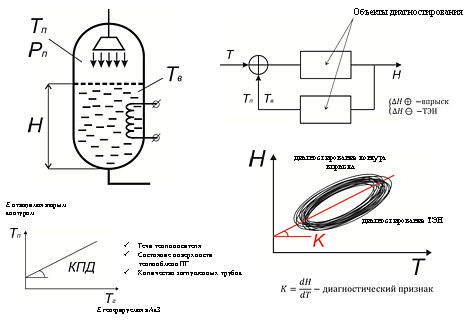 Figure 12. Diagnostics based on empirical regressions Figure 12. Diagnostics based on empirical regressions
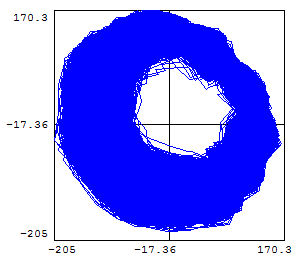 Figure 13 Figure 13Такой распространённый и универсальный инструмент, каковым является спектральное оценивание, в программных системах НТЦД имеет уникальные свойства:
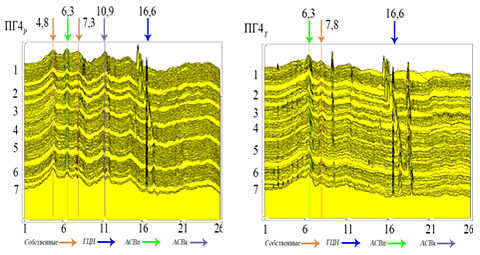 Figure 14. Основные виброисточники ПГ (ТАЭС-1) – семь кампаний Figure 14. Основные виброисточники ПГ (ТАЭС-1) – семь кампаний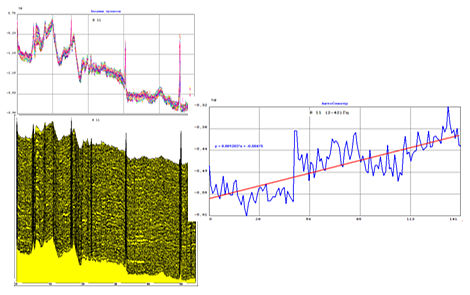 Figure 15 Figure 15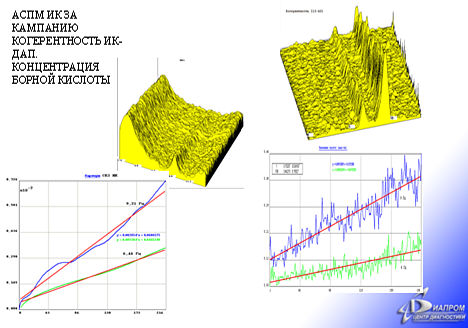 Figure 16 Figure 16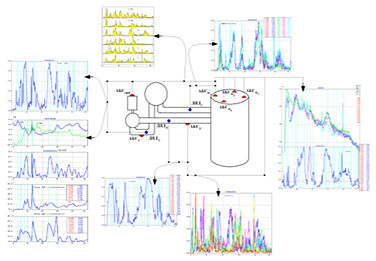 Figure 17 Figure 17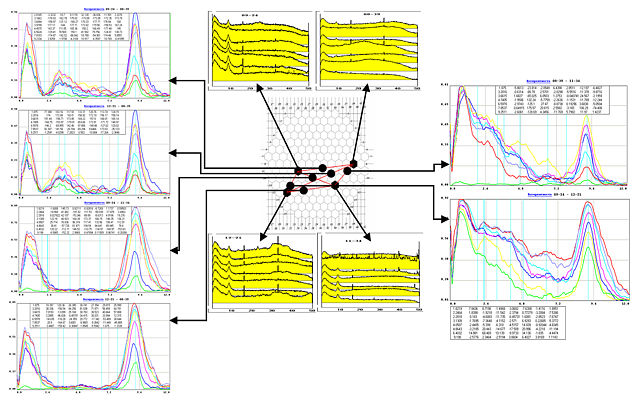 Figure 18 Figure 18
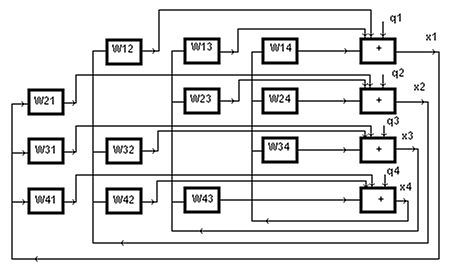 Figure 19 Figure 19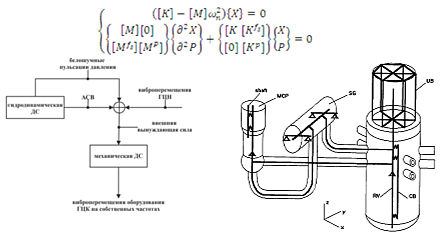 Figure 20. СВШД. Моделирование вибраций ГЦК Figure 20. СВШД. Моделирование вибраций ГЦКОтлаженные в результате многолетнего применения вычислительные модули составляют библиотеку элементарных операций, из которых конструируются сколь-угодно сложные вычислительные процедуры, называемые сценариями. Каждый сценарий применяется к новым массивам измерений и заканчивается конкретными диагнозами. Число сценариев не ограничивается, а их применение может быть реализовано как в реальном масштабе времени, так и в отсроченном режиме. Сценарный подход конструирования алгоритмов диагностирования применяется в системах:
|
| © 2003-2024 JSC "STCD" E-mail: Telephone/Fax: (495) 690-9195 |
About Us | Activities Integrated Management System | Feedback | Contacts |


|